The 'best and worst' choices
What are the best and worst food choices for the climate?
Animal products cause the most greenhouse gas emissions
Based on their greenhouse gas emissions, meat, egg and dairy products are generally the worst foods. As can be seen in the pie chart, these products also have the greatest impact on the greenhouse gas emissions of an average European diet (the situation is almost the same in the Netherlands, except for a slightly higher percentage of dairy products). This while our diet does not consist for the largest part out of animal products: We eat more bread, vegetables and fruit than meat products (in kg) on average, as can be read on the RIVM site wateetNederland.nl.
Reducing your CO2 impact can is therefore easiest done by lowering your intake of animal products and replacing them with products with a lower impact. On this page we try to help you by providing a you with a clear(er) picture of the best and worst foods in the Netherlands.
The ‘best and worst’ food types on this site
As can be seen in the table, animal products stand out, with beef being an absolute outlier. Fruit and vegetable products generally have the lowest impact of all the products on our site. Use our Foodprint Finder for more information about these foods, comparisons with other emission sources and specific improvement tips per food type. Check out this page for an extensive comparison of the different meat and fish types and meat substitutes.
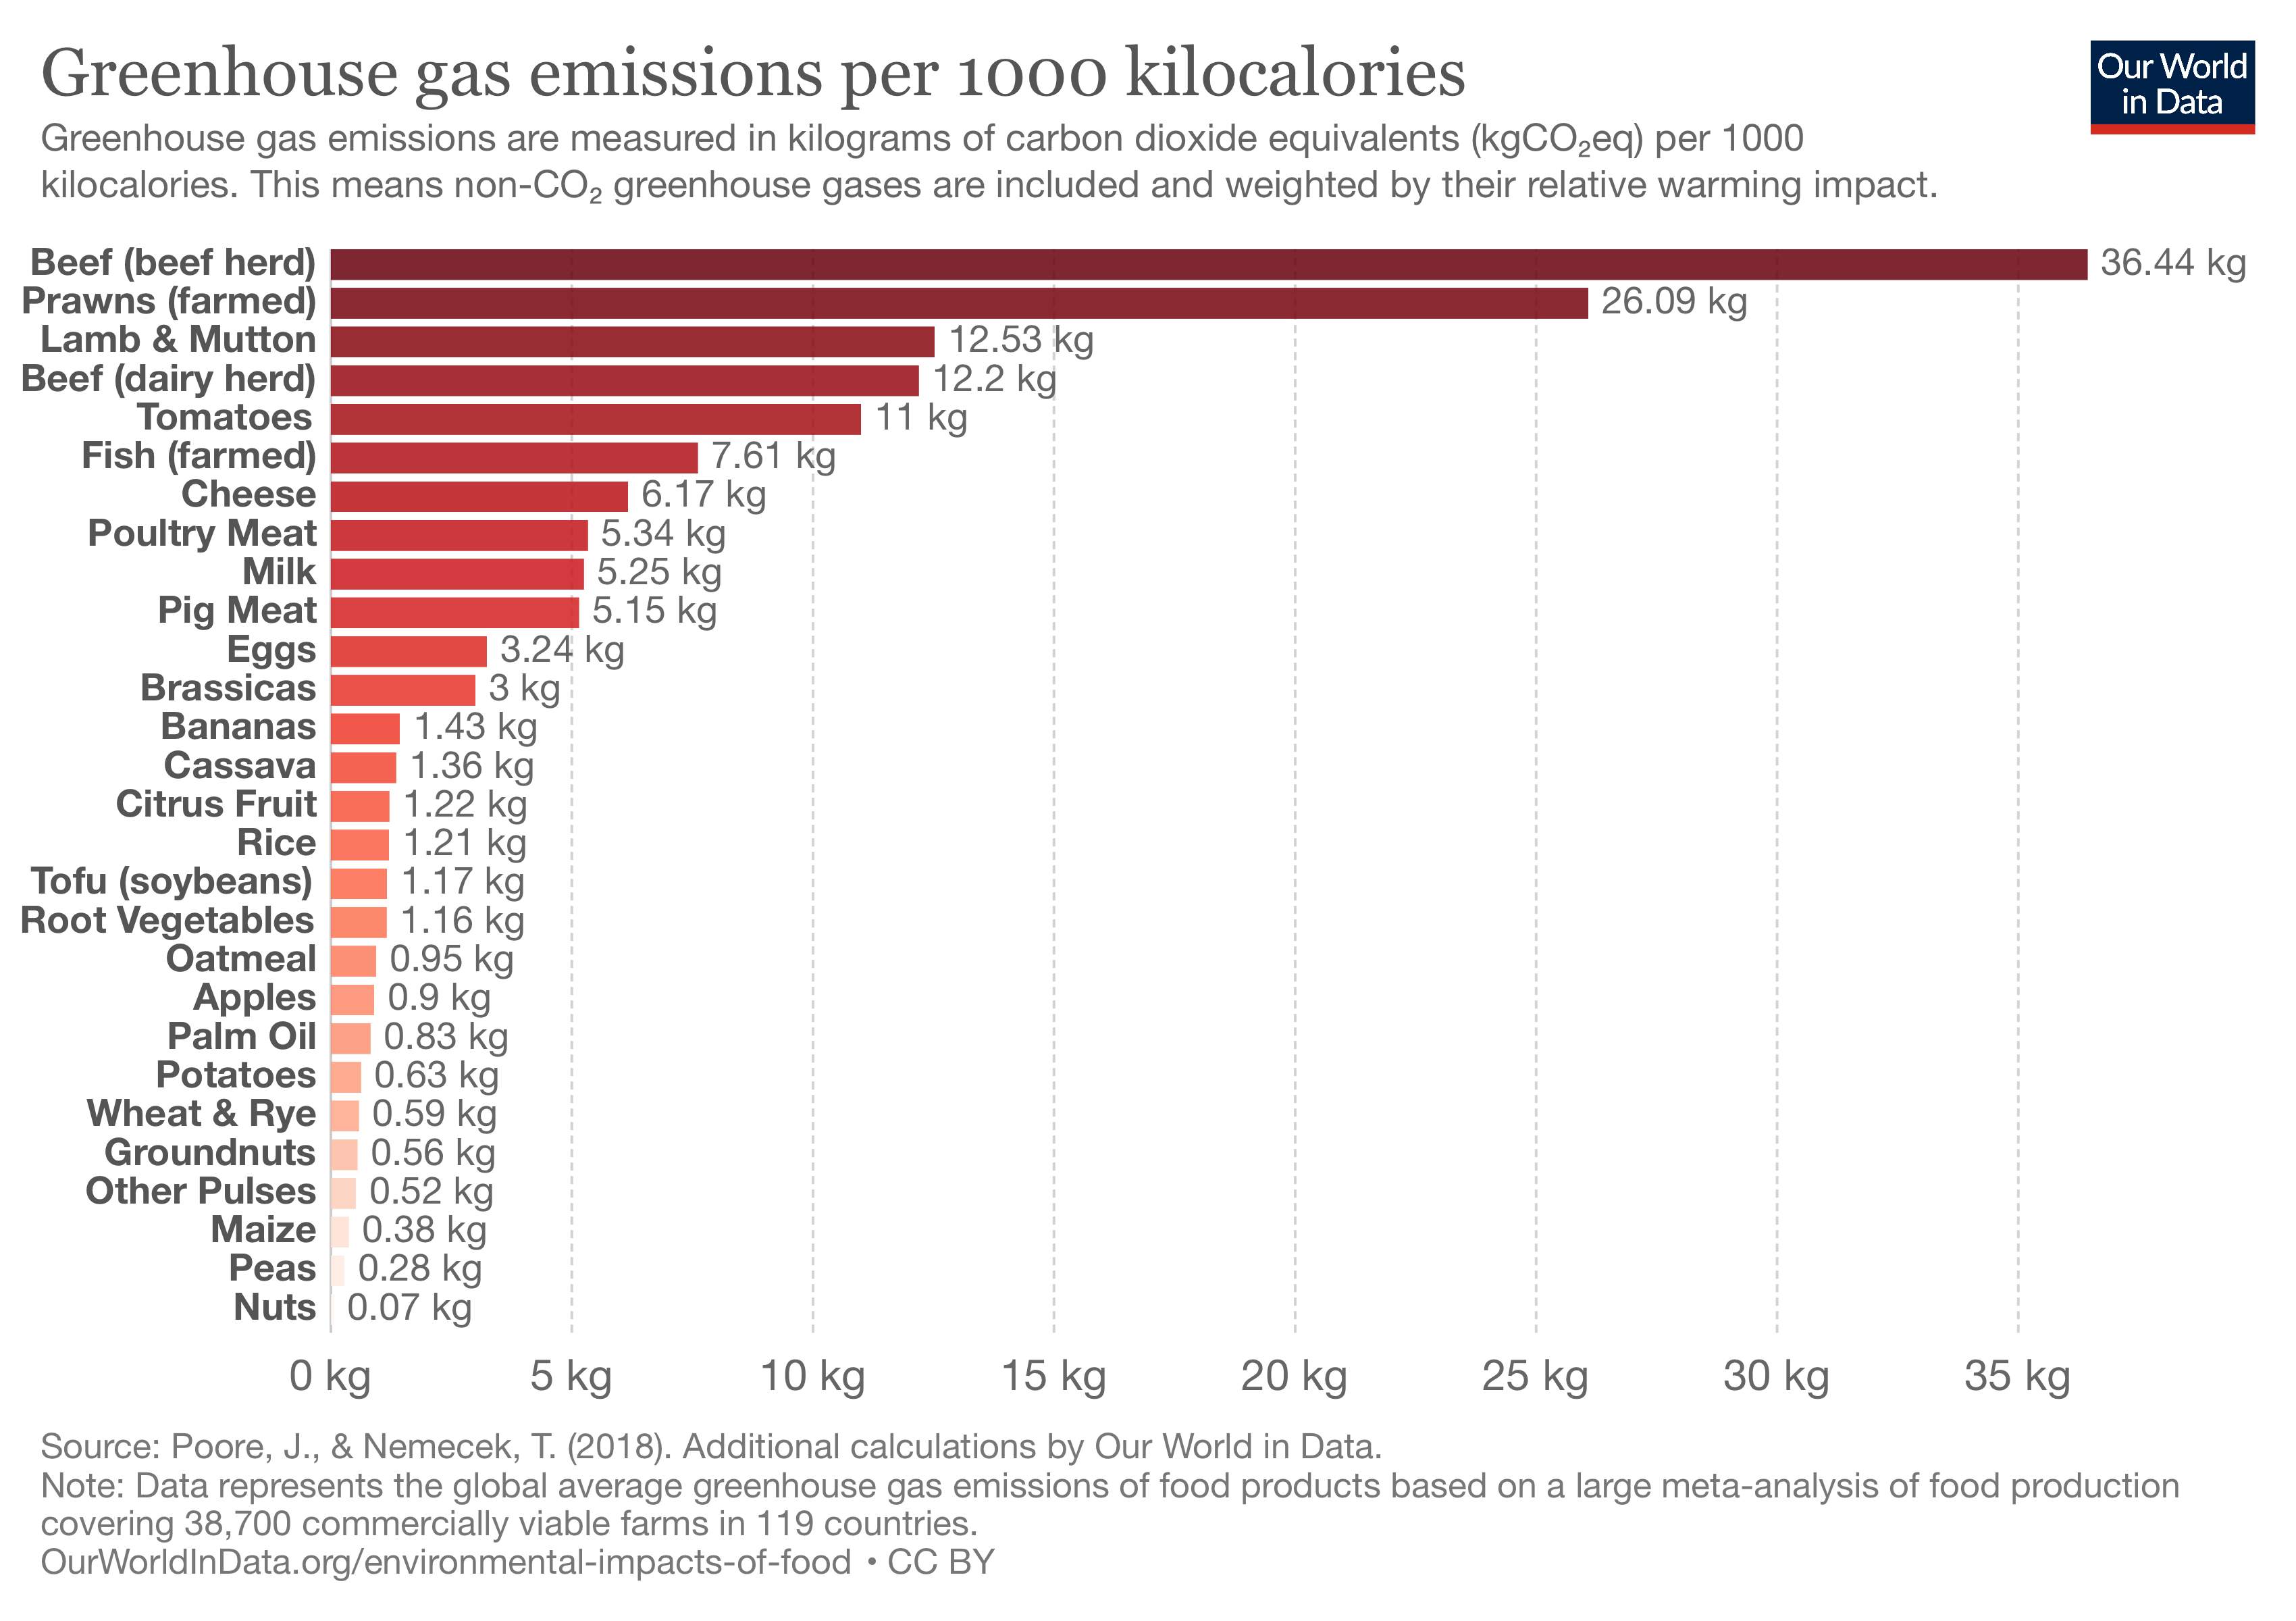
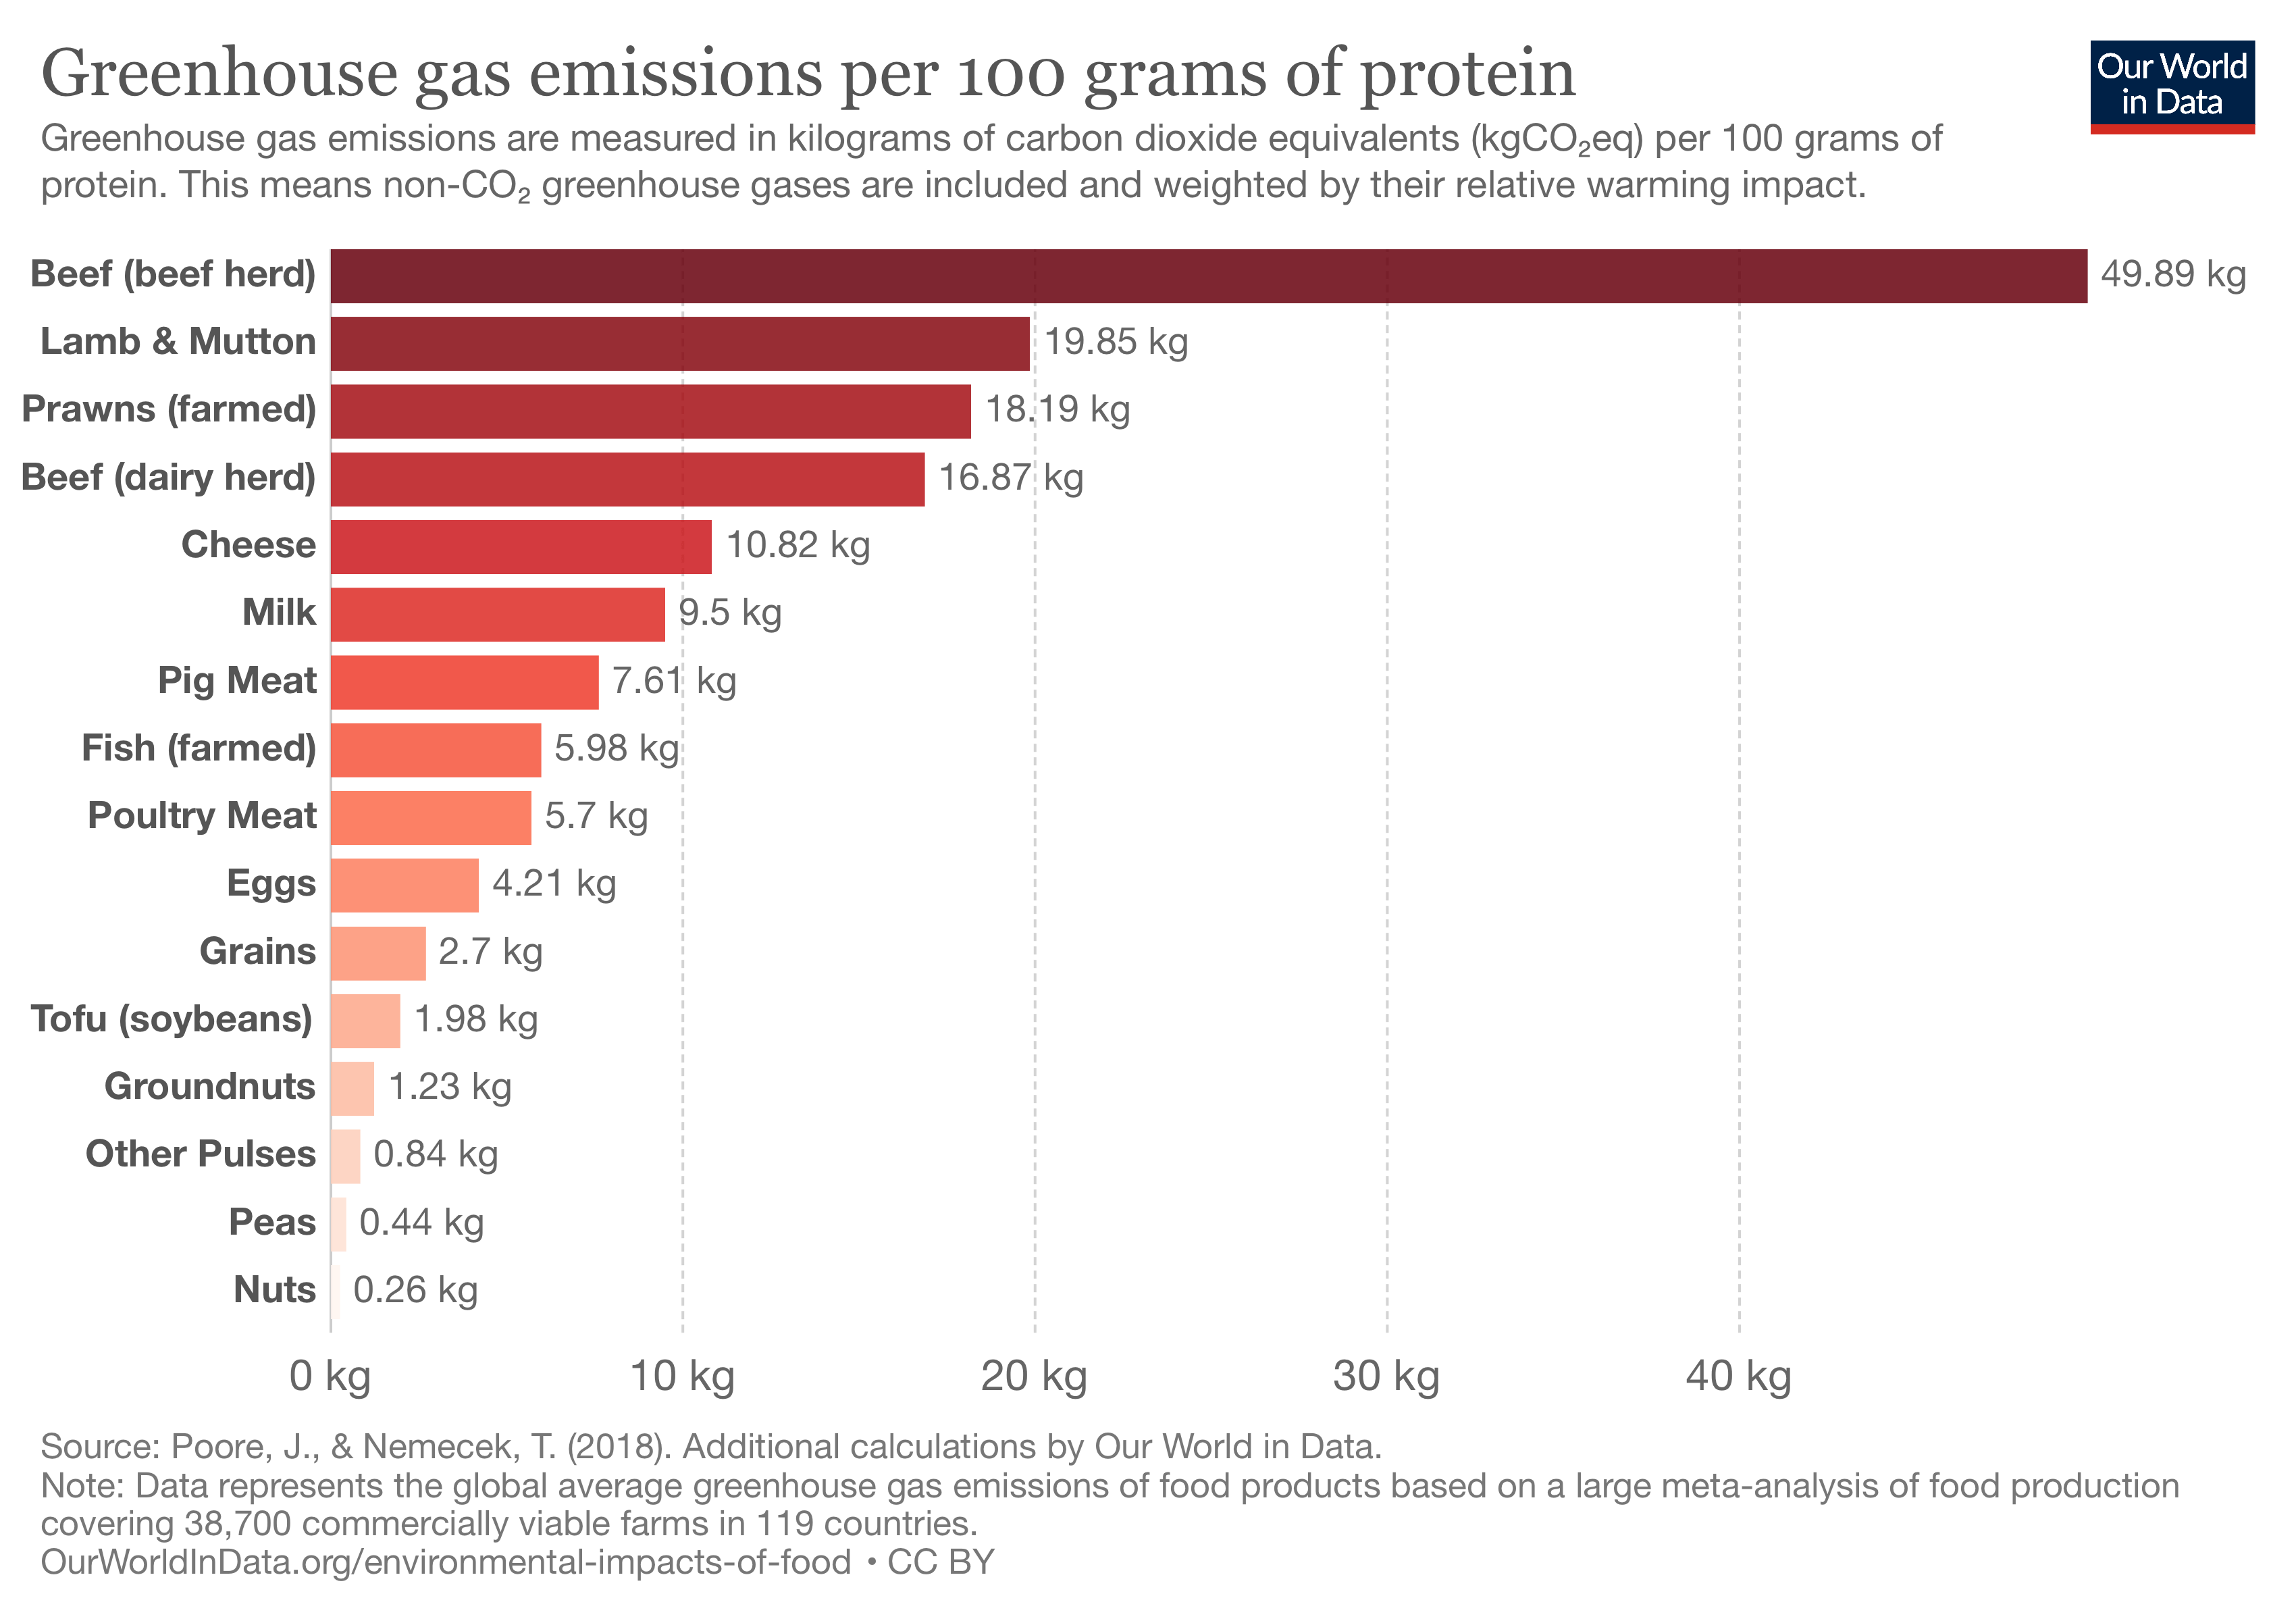
It is important to mention that this comparison is about the CO2 impact per kg of food, the list may change slightly when you compare these food types by number of calories or amount of protein (as shown below on this page).
Water & land use
When we compare the same products on the basis of water and land use (per kg), we see quite some differences with the earlier list based on CO2eq impact. Certain products stand out in terms of water use (nuts and avocado). Animal products and nuts also have a high land use. Read more here about the impact of water and land on the climate.
Differences on the basis of calories and protein
(CO2eq – Worldwide)
The lists of the best and worst foods may differ slightly when you compare the CO2eq impact on the basis of their amount of calories or protein. (Source: OurWorldinData)
Per 1000 calories

Per 100 gram protein

