
Find a new meal or food type

![]() 2 kg CO2eq **
2 kg CO2eq **![]() 36 L water ***
36 L water ***![]() 1 m2*year **
1 m2*year **
(5 stars = best, 1 ster = worst, compared to the other meals on this site)
- 1-person portion in a meal for 4 persons
- Data: average products on Dutch market (RIVM)
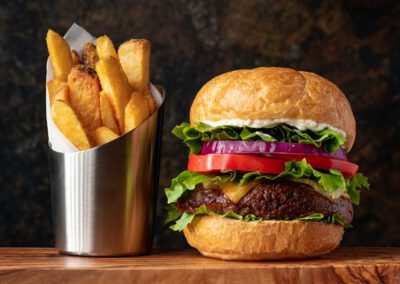
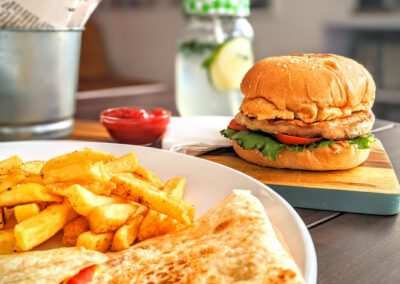
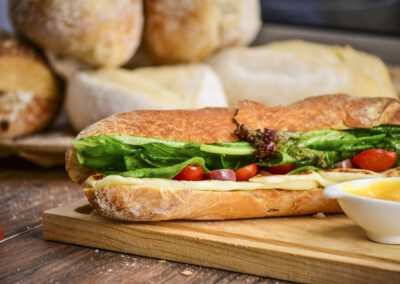
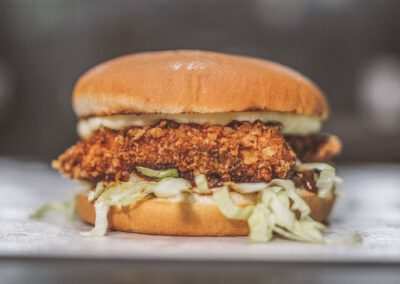
Disclaimer: exact product numbers can differ (strongly) per season / country of origin - Ingredients: White bun (50 grams), Chicken fillet (100 grams), Tomato (30 grams), Onion (raw) (10 grams), Cucumber (20 grams), Lettuce (20 grams), Fries (150 grams), Mayonnaise (30 grams).
Compare the climate impact of this meal
Compared to a 1-person portion

21.9 KM
Compared to the CO2 emissions per km of an average Dutch passenger car (Source: Rijksoverheid, CLO, 2017)

3 Minutes
Compared to the water use of an A-Z class shower in the Netherlands per minute (Source: Milieu Centraal)

16 Pavement tiles * year
Land use * year compared to the size of an average Dutch pavement tile (30cm*30cm)
Lower your impact with the following changes
Percentages and tips on basis of similar products and portions.
Disclaimer: Tips on the basis of generic data, exact numbers can differ (strongly).


Compare to other meals
Compared to a 1-person portion, on basis of a 4-person meal.
Disclaimer: Tips on the basis of generic data, exact numbers can differ (strongly).

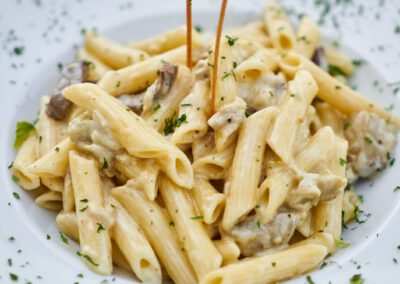
- CO2eq: Risotto is 30% better
- Water: Risotto is 76% worse
- Land: Risotto is 66% better

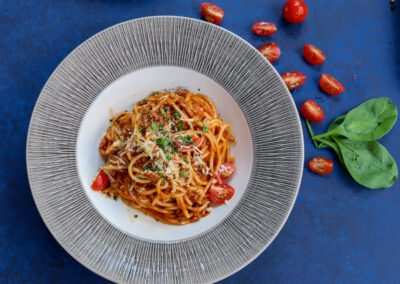
- CO2eq: Bolognese is 62% worse
- Water: Bolognese is 25% worse
- Land: Bolognese is 23% worse

- CO2eq: Burger is 85% worse
- Water: Burger is 28% worse
- Land: Burger is 52% worse
Impact of the ingredients
The distribution of the impact of the most important ingredients in this dish is shown for the 3 impact factors.
- Chicken fillet 46%
- Fries 39%
- Mayonnaise 7%
- White bun 3%
- Other 11%
- Chicken fillet 40%
- Fries 37%
- Tomato 8%
- Cucumber 5%
- Other 10%
- Chicken fillet 51%
- Fries 27%
- Mayonnaise 17%
- White bun 4%
- Other 1%
Find more meals
More meals coming soon


FAQ
Where does the data come from?
The data on the CO2eq, water and land impact of the food products originates (mainly) from the RIVM and is based on a weighted average of the emissions for the average supply of this product on the Dutch market.
Why these 3 impact factors?
These 3 factors have been chosen because they are the most important indicators of climate problems caused by food production. More explanation about the factors here .
Which factor is the most important?
For global warming, CO2eq is the most important parameter, but this does not mean that the other parameters are not important. Land use and water consumption are also causing many problems worldwide, read more here.
FAQ
Where does the data come from?
The data on the CO2eq, water and land impact of the food products originates (mainly) from the RIVM and is based on a weighted average of the emissions for the average supply of this product on the Dutch market.
Why these 3 impact parameters?
These 3 factors have been chosen because they are the most important indicators of climate problems caused by food production. More explanation about the factors here.
Which factor is the most important?
For global warming, CO2eq is the most important parameter, but this does not mean that the other parameters are not important. Land use and water consumption are also causing many problems worldwide, read more here.